Why Straddle Lab
Save time and money
Test hundreds of setups in seconds. One configuration — entry time, stop-loss, DTE, exit, costs — is an afternoon’s work on its own; testing every combination is hundreds of runs per structure, per index. We have already run those combinations, so you read the results instead of re-running them one at a time — potentially saving hundreds of hours and significant backtesting costs.
Simplicity — see it, don’t code it
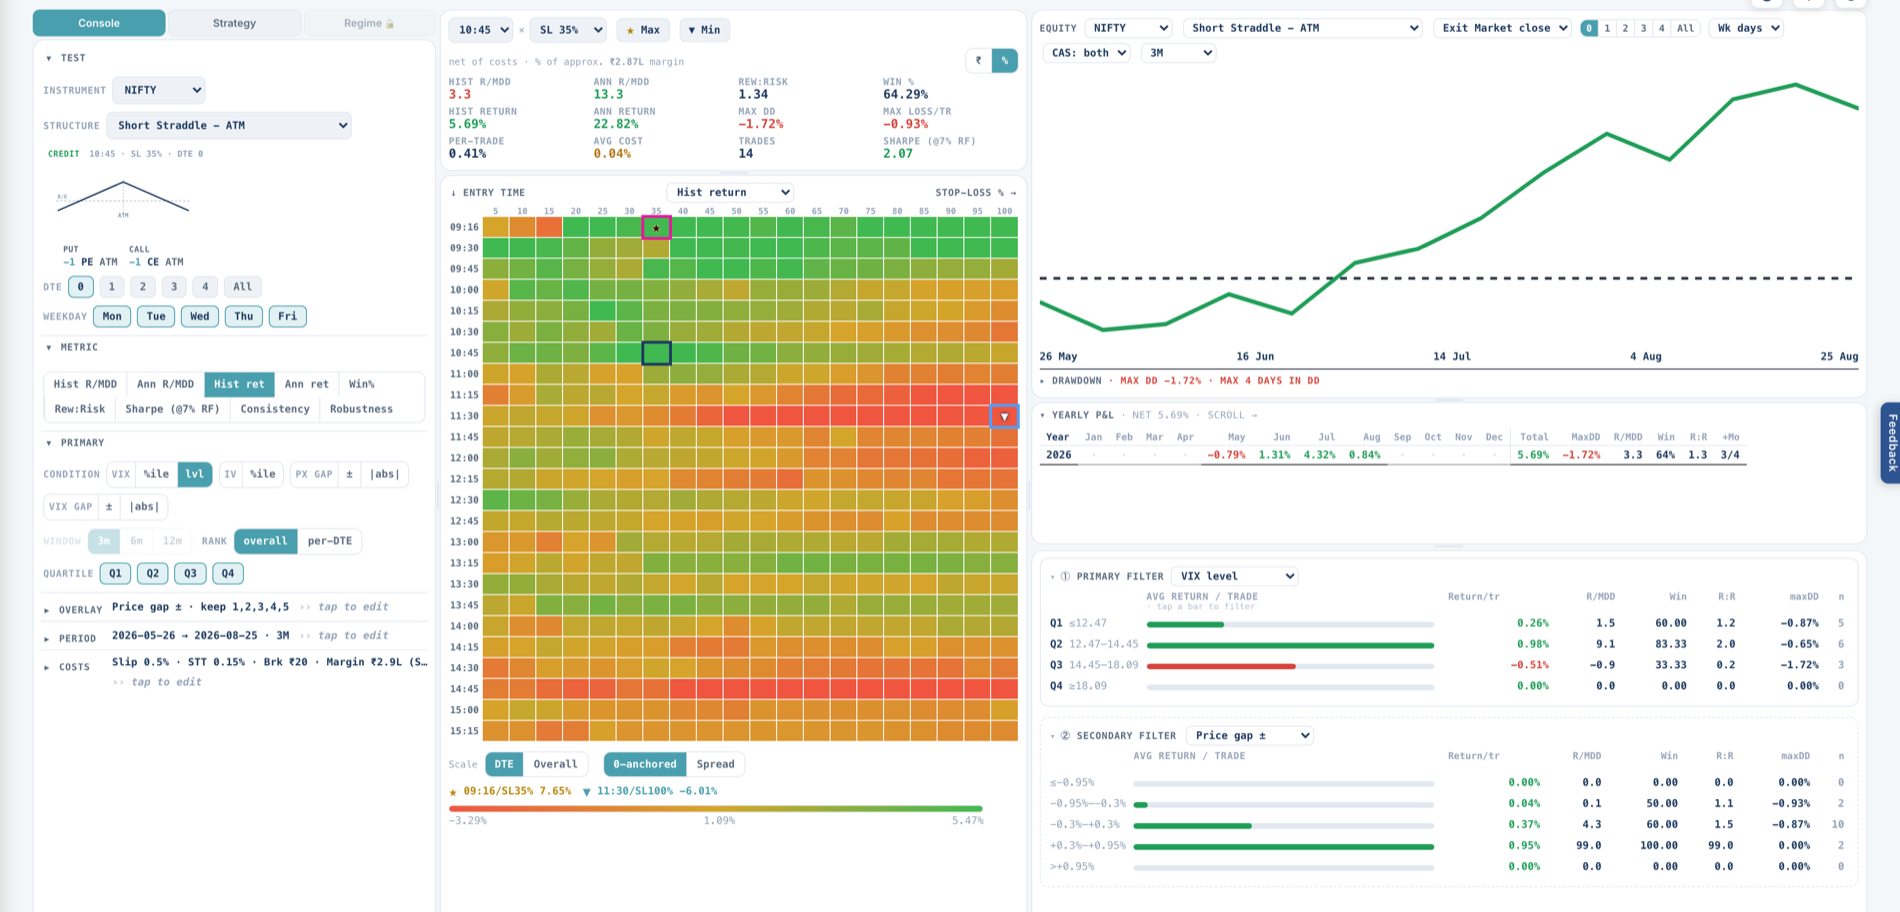
Visually refine strategies on a heatmap. The zones where straddles and strangles historically worked — and where they didn’t — are visible at a glance. Click a cell, flip a filter, change a cost: every number updates instantly. No code, no spreadsheets.
Intelligent regime analytics
Identify the volatility and price-gap regimes under which a setup was historically most effective — slice every result by VIX percentile or level, IV percentile, and opening-gap / VIX-gap conditions, and read cells on our proprietary Consistency and Robustness metrics instead of one blended average.
All of it rests on the data and the engine: granular, high-quality, exchange-grade intraday options market data and a battle-tested backtest engine — regime readings with no look-ahead, and every cost assumption visible and adjustable in the tool.
Who it’s built for
Intraday non-directional options sellers — traders capturing theta decay and volatility crush with straddles, strangles and their winged variations, closed the same day.
Systematic sellers
Shortlist parameter zones across the full grid before spending time or budget re-testing them in your own stack. Compare how results varied across years and regimes — including where a pattern weakened or disappeared.
Discretionary sellers
See how your structure historically behaved under VIX-percentile, IV-percentile and opening-gap conditions comparable to today’s — historical context for your own judgment, not a signal.
What Straddle Lab gives you
Entry-time × Stop-loss heatmap
Every combination of entry slot and stop-loss level, displayed on the metric you choose — annualised return-to-drawdown, win rate, reward:risk, Sharpe and more. Differences across the historical sample are visible at a glance.
Beyond straddles
Short strangles at multiple OTM distances, iron flies, iron condors and Batman structures at multiple wing widths — plus DTE, weekday, exit-time and closing-auction splits on each.
Adjustable modelled costs
Slippage, brokerage, STT, lot multiples and margin are modelled in your browser and update every number instantly. See exactly what the cost assumptions do to a displayed result — they remain estimates, and actual execution and charges may differ.
Volatility & gap regime filters
Slice history by VIX percentile or level, IV percentile, and opening-gap / VIX-gap conditions. See how the same straddle behaved on calm vs stressed days — not just on average.
Stop-loss modes & delayed entries Pro
Stop the combined premium, each leg on its own, or leg-wise with a break-even stop on the surviving leg. Enter at the clock, or only once a leg or the combined premium has decayed by a set percentage. Every variant is its own full backtest on straddles and strangles.
No downloads, no installs
Runs entirely in your browser, on desktop and mobile. Create an account and start exploring right away.
How it works
1 · Choose
Pick an index and a structure — straddle, strangle, iron fly, iron condor — plus DTE, weekday, stop-loss mode and entry trigger.
2 · Compare
Read the entry-time × stop-loss heatmap on the metric you care about; every cell is one full historical backtest.
3 · Refine
Apply cost assumptions and volatility / gap regime filters to narrow a shortlist worth your deeper work.
Historical analysis only — not a trade signal or recommendation.
Watch the walkthrough
ARIA walks through the dashboard, structures, costs, filters, the Strategy tab and Regime matching, then works a fixed-date historical example end to end. About 19 minutes; chapters are in the video description.
Software walkthrough, not a recommended strategy or trade setup; the example uses historical backtested results, not actual trading results. ARIA is an AI-generated presenter — editorial responsibility remains with Quantimental Capital Research. Interface and plan labels are as recorded in September 2026. Hosted on YouTube; playback is subject to YouTube’s terms.
See before you sell.
Years of intraday option-selling history, read at a glance.
Start free. Upgrade when you need depth.
Every eligible new account gets the Lab free for its first month — no card, no commitment; it simply lapses. Go Pro for the full 2021–present history and the current-regime analytics. Plans never auto-renew.
Focused scope: intraday index-option selling analytics — not arbitrary strategy coding, signals, broker execution or trade calls. Full scope details below.
- Latest 3 months of data
- NIFTY, SENSEX & BANKNIFTY
- Straddles, strangles, iron fly & iron condor
- Full entry-time × stop-loss heatmap
- Full cost model (slippage, brokerage, STT)
- Regime & gap filters — VIX/IV percentile, level, gaps
- Stop-loss modes & entry-decay triggers (Pro for now)
- Current-regime analytics locked (dashboard & comparison)
Lapses after a month — nothing to cancel, nothing charged.
- Everything in Free, plus:
- Full history of data (2021–present)
- Batman structures at multiple wing widths
- Stop-loss modes (overall, leg-wise, leg-wise break-even) and entry-decay triggers on straddles & strangles
- Current-regime dashboard & historical regime comparison
- Any structures, tools & data QMCR adds to Pro during your active period — no particular future release is promised
Secure checkout via Cashfree. Or redeem an invite code to unlock full history.
Have an access code from us? Redeem it on your account page.
What Straddle Lab is — and what it is not
Straddle Lab is a focused self-service research & analytics tool and strategy library — not an RA research subscription, not a recommendation, and not a general-purpose backtester. We would rather you know exactly what you are buying:
- It is not a full backtest engine for arbitrary strategies — you cannot code or upload your own strategy, and it does not cover equities, futures, positional option strategies, or option buying systems.
- Its scope is intraday index-option selling — primarily short straddles and strangles, plus their winged variations (iron fly, iron condor and related structures) on NIFTY, SENSEX and BANKNIFTY. Every backtested position opens and closes the same trading day.
- It provides no live signals, no alerts, no broker connection and no execution. It answers one question deeply: how have these specific intraday structures behaved historically, under which conditions, and at what cost.
- It is not advisory — the tool issues no recommendations or trade calls; it shows you historical data, and the decisions stay yours. “Research” here means research you do with the tool: Straddle Lab is a pure software subscription, not a research service under the SEBI (Research Analysts) Regulations — no reports, recommendations or model portfolios are provided as part of it. Backtest results are not a guarantee or indicator of future returns.
If that focused question is the one you are asking, Straddle Lab brings the whole analysis into one interactive workflow.
Free vs Pro — what changes
The heatmap shows results for every combination of entry time and stop-loss level. More historical data means more expiry sessions inside each cell — a larger sample contains more observations, though no historical result is predictive of future trading.
| Plan | History shown | Approx. expiry sessions | Current-regime analytics | Best for |
|---|---|---|---|---|
| Free · first month | Latest 3 months | ~12–15 (NIFTY/SENSEX weekly; fewer for BANKNIFTY) | — | Learning the tool and studying the most recent behaviour |
| Pro | Full history — NIFTY/BANKNIFTY from 2021, SENSEX from mid-2023 | ~250+ (NIFTY/SENSEX weekly; BANKNIFTY monthly, far fewer) | Included | Multi-year, multi-regime studies — e.g. rolling VIX-quartile windows only full history supports |
Note: BANKNIFTY covers monthly expiries only — the last 4 trading days before each monthly expiry (weekly BANKNIFTY expiries were discontinued). That is far fewer cycles than NIFTY/SENSEX weekly expiries, so treat BANKNIFTY samples with extra caution.
Why full history matters
The free plan’s 3-month window is enough to learn the tool and study recent behaviour. But volatility- and gap-conditioned analysis needs many more sessions to mean anything: to compare how straddles behaved across VIX quartiles, high- vs low-IV regimes, or gap-up vs gap-down days, you need enough expiry cycles in each bucket to avoid reading noise. Some studies aren’t even possible on short windows — a 12-month rolling VIX-quartile ranking needs more than a year of history before its first data point exists. Pro unlocks the full 2021–present window so you can test whether a pattern was broad-based across regimes or an artefact of a handful of sessions.
Common questions
What happens after my free month?
Access simply lapses — nothing is charged and there is nothing to cancel. Go Pro whenever you want the full history and regime analytics.
Do plans auto-renew?
No. Every plan has a fixed validity and simply ends. Renewing is always your explicit choice.
Is this a full-fledged backtester or a signal service?
It is a backtesting research tool — with the backtesting already done for you. Instead of coding and running strategies one at a time, you explore the results of every entry-time × stop-loss × structure combination we have already tested, and slice them by market conditions. It is not a signal service: nothing here is a trade call or a recommendation. Full scope.
What does Pro history cover?
NIFTY from January 2021 and BANKNIFTY from late 2021 to the present; SENSEX from mid-2023, when its weekly series began on our data. Hundreds of expiry sessions on the weekly indices, refreshed as new sessions complete.
Why are purchases non-refundable?
Plans deliver full access to the licensed dataset from day one, so sales are final once activated — the free month exists precisely so you can evaluate before paying. Refund & Cancellation Policy.
No refunds — please read before purchasing
Straddle Lab plans are software-tool subscriptions with a fixed validity, activated after payment confirmation or manual verification — a self-service, non-advisory software product of QMCR (no recommendations are provided against the fee). Once a plan is activated, sales are final: non-use, elapsed time, change of mind, trading losses, or dissatisfaction with historical results are not grounds for refund. Except for verified billing errors and rights that cannot lawfully be excluded, the one contractual refund circumstance is: if we permanently discontinue the tool or end your paid access other than for your breach, the unexpired portion is refunded proportionately. Plans do not auto-renew — they simply lapse; there is nothing to cancel. Use the free first month to evaluate the tool before paying.
For billing queries, email support@qmcr.in. Full policy: Refund & Cancellation Policy.
Historical analytics software — not advice or a recommendation
Straddle Lab is a self-service research, analytics and educational software tool. It is non-advisory. It models intraday positions only — every backtested position is opened and closed within the same trading day. All heatmap results are based on historical backtests and modelled transaction costs. Historical backtest results are not a guarantee of future returns, do not represent actual traded performance, and may not match actual trading, broker execution, slippage, liquidity, margin, taxes, charges, rejected orders, partial fills, or market conditions. Derivatives trading involves the risk of substantial loss. This tool does not constitute investment advice, a research recommendation, or a solicitation to trade. Use it to inform your own analysis and independent judgment — not as a substitute for them.