Quantimental Capital Research | SEBI RA INH000027964
NIFTY and SENSEX • Data through 8 October 2026
Our findings in brief
Expiry-day premium is surviving much longer into the afternoon. At the 3:15 pm checkpoint, the median NIFTY straddle retained 61% of its opening premium after the Closing Auction Session (CAS), against 12% across usable earlier history. For SENSEX, the comparison was 66% against 8%.
A seller is now exposed to the same amount of index movement, but collects far less decay for it. The index itself did not get wilder: its daytime range, measured against the opening premium, is 1.56 before and after on NIFTY expiry day, and lower on SENSEX. What changed is how much premium drains away during the day — much less of it. Dividing movement by decay therefore roughly doubles, because the decay underneath the fraction shrank. That is a ratio of group medians describing the trade-off, not a forecast that any seller's losses double.
The day before expiry, DTE1, gives a mixed picture. NIFTY's range-to-premium-reduction ratio rose, while SENSEX's fell slightly; neither change passes the adjusted statistical test. Ten post-CAS dates per group are not enough to conclude that DTE1 is unchanged. Nor is there a statistically established trend towards steadily calmer post-CAS expiries.
What CAS does and why it was introduced
CAS pools buy and sell orders to determine a closing price, replacing the last-half-hour weighted-average method for eligible stocks. SEBI's aims include clearer closing-price discovery, more efficient execution of large orders and helping passive funds trade at the price used by their benchmark. SEBI framework.
NSE and BSE publish the same 20-minute schedule, which matters here because NIFTY is an NSE index and SENSEX a BSE one. Eligible stocks leave continuous trading at 3:15. A reference-price and transition phase runs to 3:20; orders are then collected from 3:20 to 3:30, with a system-driven random stoppage in the last two minutes. No trades execute during that collection phase—matching and trade confirmation happen between 3:30 and 3:35, after which a transition or buffer period runs to 3:50 and the post-closing session to 4:00. Equity derivatives continue trading until 3:40. Eligibility is phased in, beginning with stocks that have derivative contracts; the indices themselves are not auctioned, they move with their constituents. Indicative prices show where the auction would clear as orders change. NSE session details · BSE notice 20260610-41.
That schedule has a direct consequence for measurement. Because eligible constituents execute no trades between 3:20 and 3:30, the recorded index after 3:20 stops moving on new trade prices. In our own minute data this is unmistakable: across the 243 sessions studied, the longest run of identical index bars between 3:15 and 3:29 is one minute in every pre-CAS session, and reaches 13–14 minutes in all forty post-CAS index-sessions. The index feed is not faulty; the continuous market it reflects has closed. We therefore do not publish any index-range comparison inside 3:15–3:30, because the post-CAS figure would measure the absence of continuous trading rather than market movement. Everything quoted below as a range runs to the 3:15 checkpoint. Options are different—equity derivatives keep trading to 3:40—so a premium observation in that window remains meaningful, and is reported separately and clearly labelled.
The hypothesis we tested
If uncertainty about the auction close preserves expiry premium, ordinary intraday decay should weaken—especially in the afternoon—and more premium should remain exposed to the closing event. The effect should be more pronounced on expiry day, DTE0, than on the preceding trading day, DTE1.
A competing explanation is simply a different volatility environment. We therefore compare all usable pre-CAS history, the final two pre-CAS months, and earlier observations within comparable opening India VIX levels. We also check whether the underlying range itself increased.
The overall premium profile
A straddle combines a call and a put at the same strike. The curves follow the strike nearest the index at each checkpoint, with each day's opening premium set to 100. They describe rolling market pricing rather than the return on an unchanged position. We measure observed premium reduction, not pure time decay: volatility, index moves and changes in the selected strike also affect these prices.
| Premium retained at the 3:15 pm checkpoint | All usable pre-CAS history | Final two pre-CAS months | Post-CAS (10 dates) |
|---|---|---|---|
| NIFTY DTE0 | 12.4% | 11.6% | 60.9% |
| SENSEX DTE0 | 8.5% | 8.1% | 65.8% |
| NIFTY DTE1 | 79.7% | 78.0% | 89.3% |
| SENSEX DTE1 | 78.0% | 79.1% | 81.8% |
The 3:15 pm checkpoint uses the close of the minute beginning at 3:14 pm—a boundary proxy, not an exact 3:15 tick. All-history tests use all ten post-CAS dates; comparable-VIX tests use eight matched-band post dates. Both DTE0 comparisons pass the exploratory adjusted threshold of 0.05, with p approximately 0.031. The two-month and DTE1 comparisons do not. A non-significant result does not establish that behaviour is unchanged.
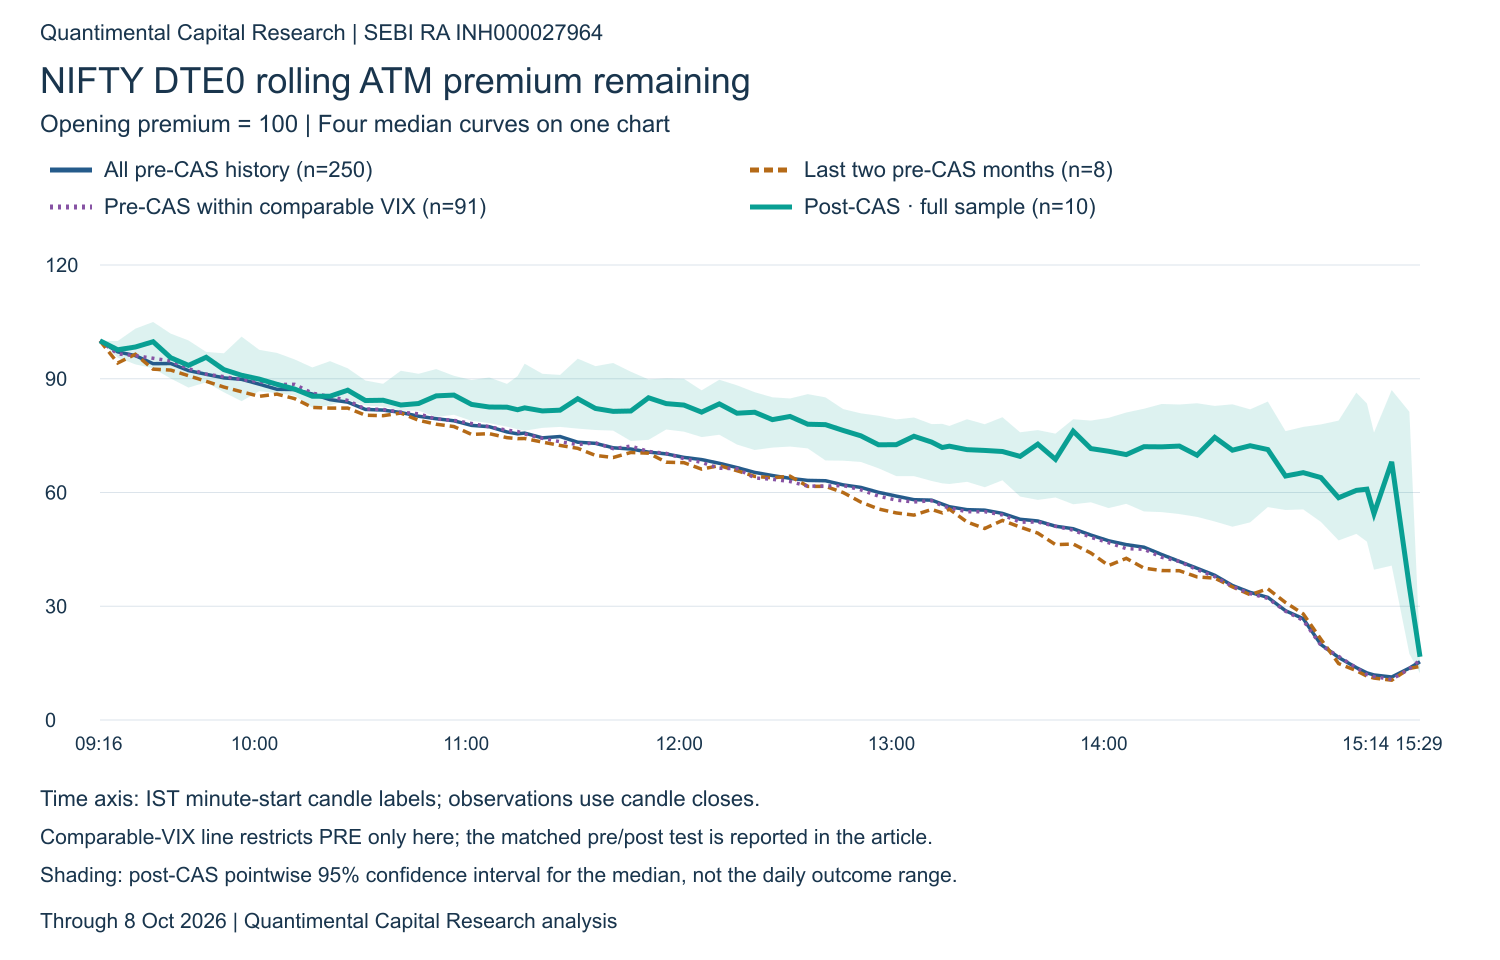
NIFTY DTE0 decay curves
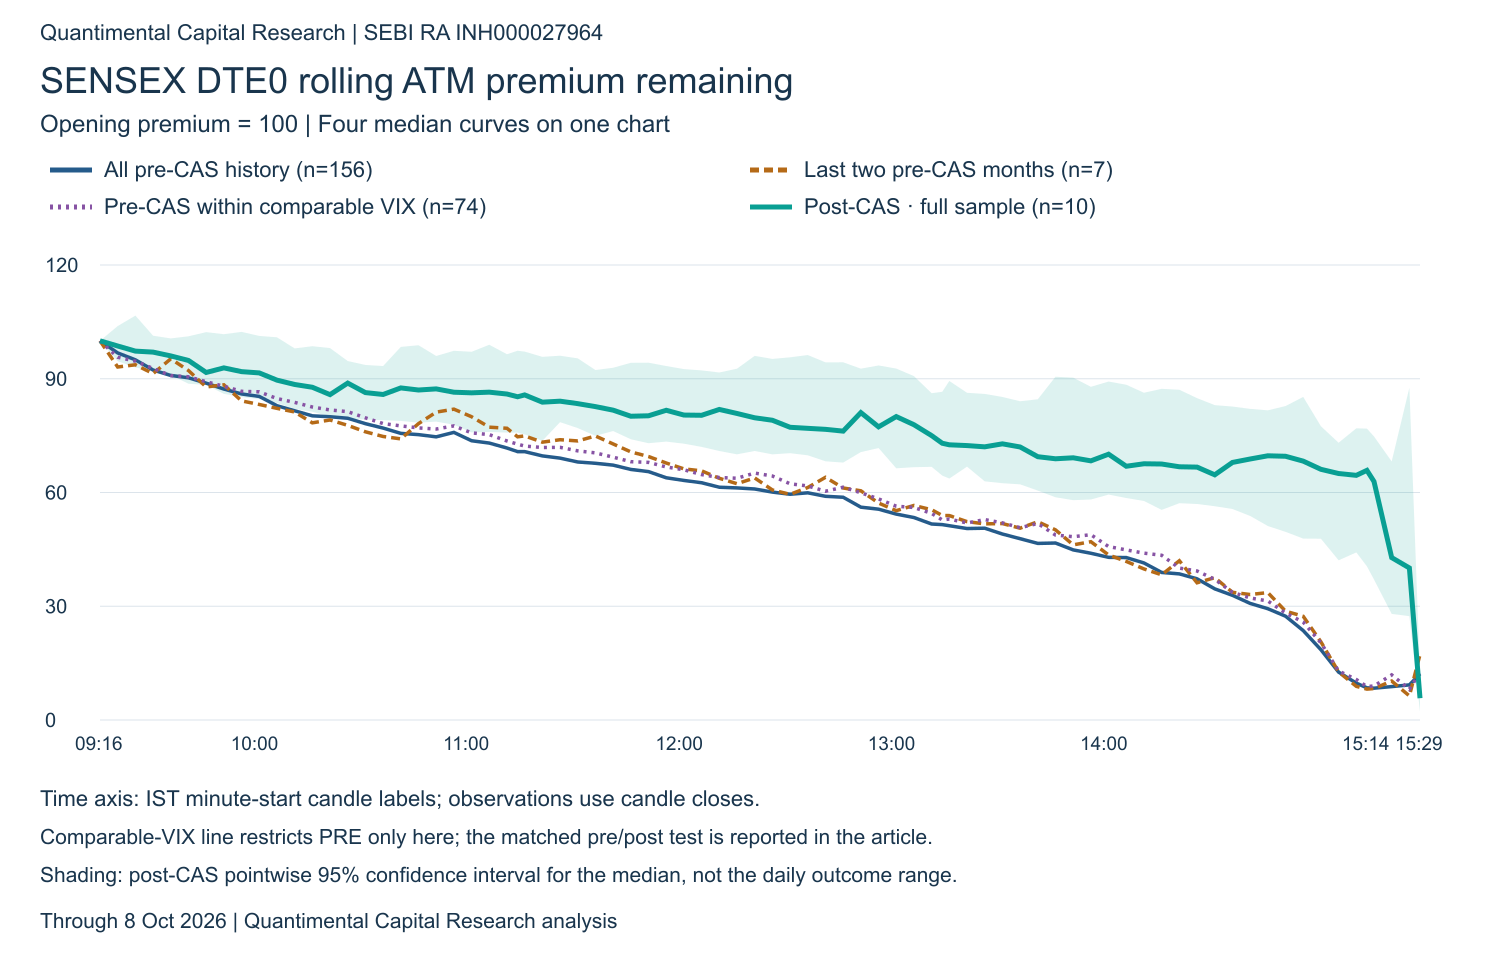
SENSEX DTE0 decay curves
Each chart combines the three historical baselines with the full post-CAS sample. The post-CAS shading is the pointwise 95% bootstrap confidence interval for its median, not the range of individual trading-day outcomes. The comparable-VIX historical line is descriptive against that full sample; the statistical check below restricts both periods to the same VIX band.
| Index / expiry | Pre / post dates | Premium retained at 3:15 pm · comparable VIX | Adjusted p | Significant? |
|---|---|---|---|---|
| NIFTY DTE0 | 91 / 8 | 12.0% → 70.5% | 0.031 | Yes |
| NIFTY DTE1 | 71 / 8 | 80.3% → 89.3% | 1.000 | No |
| SENSEX DTE0 | 74 / 8 | 8.8% → 72.2% | 0.031 | Yes |
| SENSEX DTE1 | 65 / 8 | 79.6% → 81.8% | 1.000 | No |
Which part of the day changed
The afternoon is where the contrast becomes clearest. Each figure below is the median reduction as a percentage of the same day's opening premium, comparing the previous twelve months with post-CAS observations.
| Index / expiry | Session (IST) | Before → after | Adjusted p | Significant? |
|---|---|---|---|---|
| NIFTY DTE0 | Morning · 9:17–11:15 am* | 25.2% → 18.2% | 1.000 | No |
| NIFTY DTE0 | Midday · 11:15 am–1:15 pm | 20.1% → 14.0% | 1.000 | No |
| NIFTY DTE0 | Afternoon · 1:15–3:15 pm | 44.6% → 7.6% | 0.031 | Yes |
| SENSEX DTE0 | Morning · 9:17–11:15 am* | 25.8% → 14.7% | 1.000 | No |
| SENSEX DTE0 | Midday · 11:15 am–1:15 pm | 18.2% → 13.9% | 1.000 | No |
| SENSEX DTE0 | Afternoon · 1:15–3:15 pm | 45.4% → 13.5% | 0.031 | Yes |
| NIFTY DTE1 | Morning · 9:17–11:15 am* | 9.2% → -1.7% | 0.111 | No |
| NIFTY DTE1 | Midday · 11:15 am–1:15 pm | 4.1% → 3.3% | 1.000 | No |
| NIFTY DTE1 | Afternoon · 1:15–3:15 pm | 5.8% → 5.5% | 1.000 | No |
| SENSEX DTE1 | Morning · 9:17–11:15 am* | 9.9% → 6.4% | 1.000 | No |
| SENSEX DTE1 | Midday · 11:15 am–1:15 pm | 4.7% → 4.1% | 1.000 | No |
| SENSEX DTE1 | Afternoon · 1:15–3:15 pm | 5.4% → 5.5% | 1.000 | No |
Negative means premium increased. All times are IST and approximate minute-close boundaries. *The morning sample begins at the close of the 9:16 am candle, around 9:17 am—not the 9:15 am market open. Midday runs 11:15 am–1:15 pm; afternoon runs 1:15–3:15 pm. Session medians need not add to the whole-day median. Significance uses global Holm-adjusted p < 0.05 against the preceding twelve months; “No” does not prove no change.
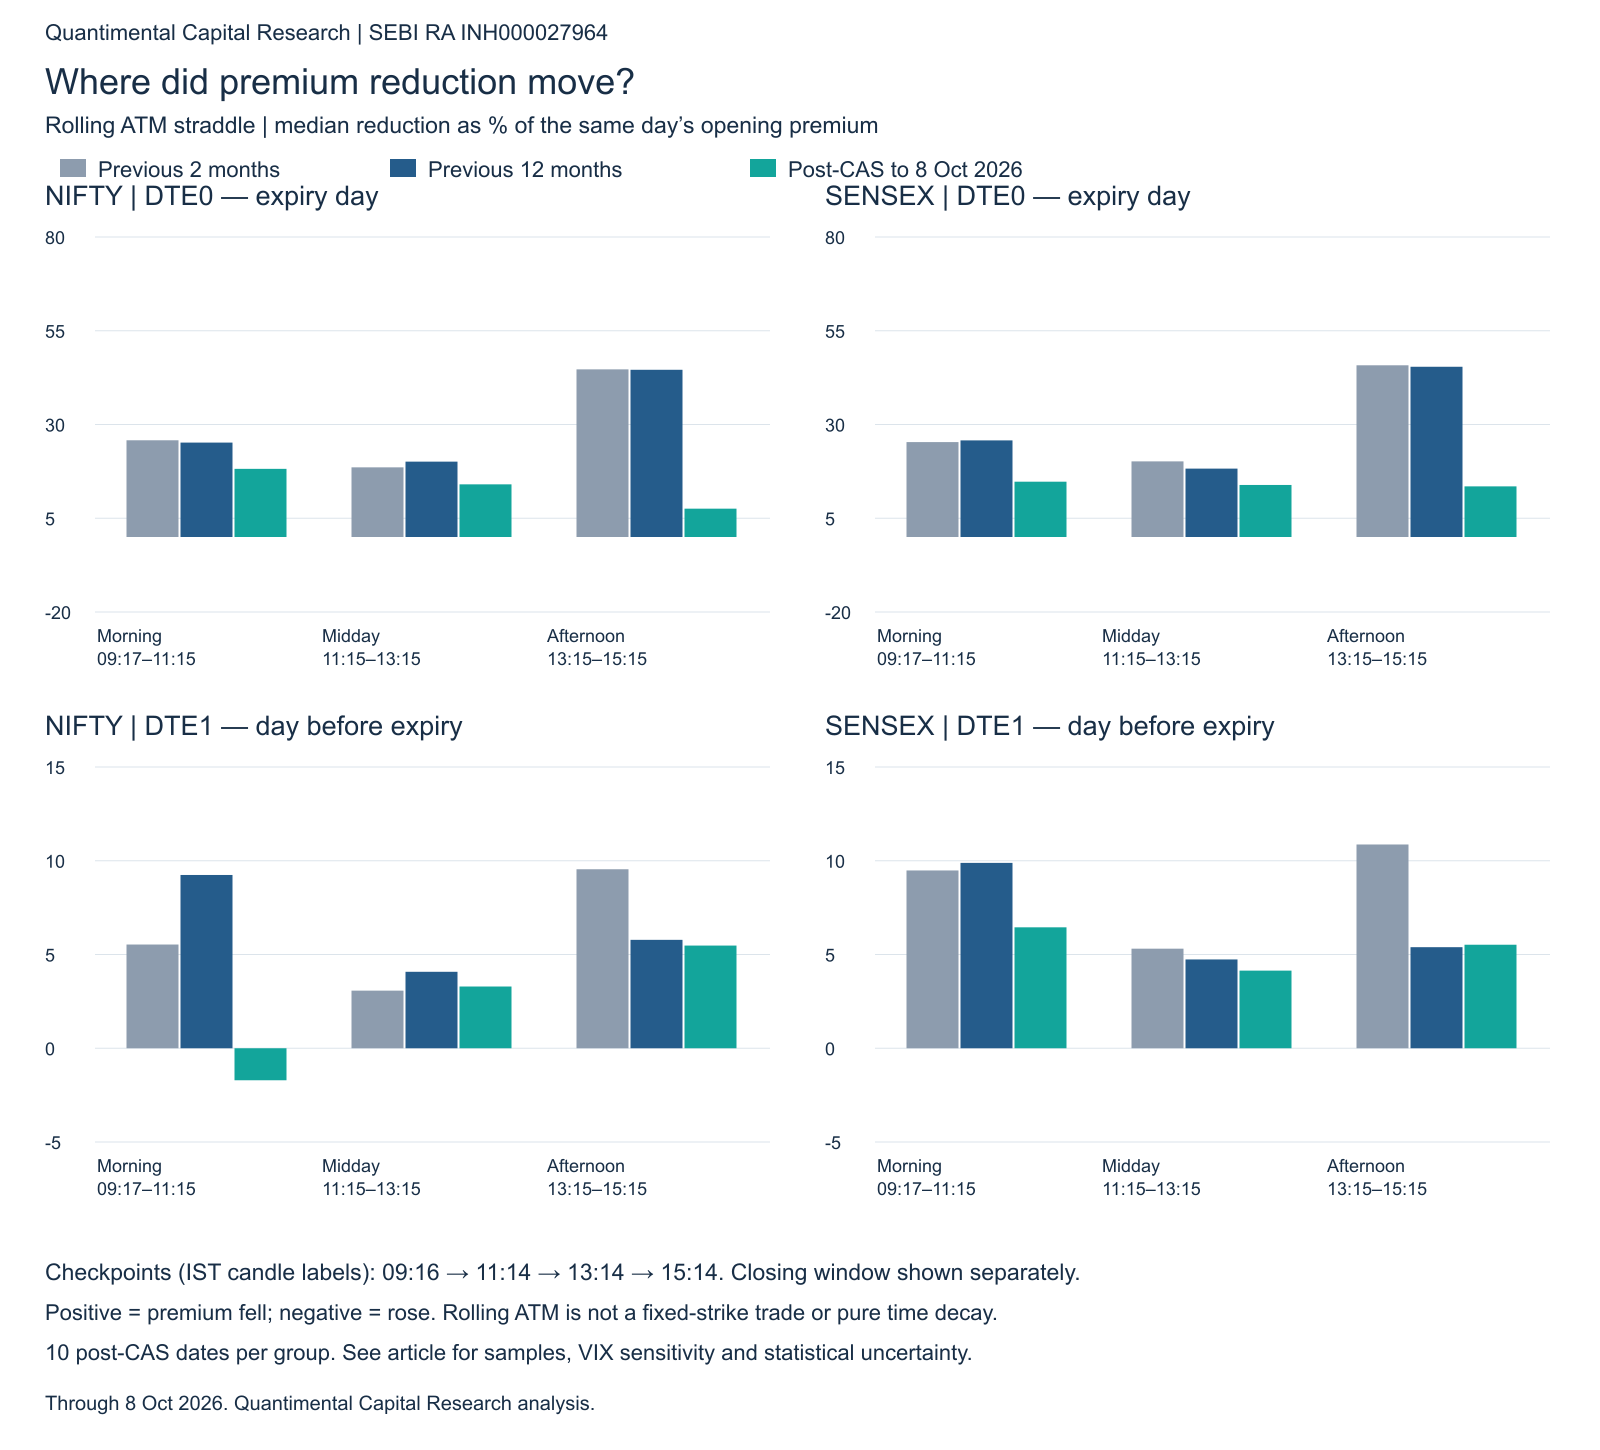
Session-wise premium reduction bars
The DTE0 afternoon differences against the twelve-month baseline remain significant after the global adjustment, at approximately p = 0.031. No DTE1 session comparison survives that adjustment. This supports the predicted expiry-day timing pattern, without proving that CAS alone caused it.
For 3:15–3:30, we separately hold the strike selected at 3:15 unchanged. Median reduction as a percentage of that window's starting premium rose from 5.6% to 62.6% for NIFTY DTE0 and from 12.7% to 46.2% for SENSEX DTE0. These fixed-strike differences do not survive the global statistical adjustment. Their direction fits the hypothesis, but is weaker evidence than the daytime finding. They cannot be added to the rolling-series percentages above. This is an options observation: the derivatives segment trades through this window even though the cash market does not, so it carries no implied claim about index movement between 3:15 and 3:30, and the underlying closing-window series remains subject to the official-price reconciliation noted below.
What this means for option sellers
Think of it as what a seller is paid for the risk taken. The risk is how far the index travels during the day; the payment is how much premium decays. We divide the first by the second, so a higher number means more movement endured for each point of decay collected — a worse deal. Both halves are group medians, so the result describes the cohort, not a typical day and not any trade's loss multiple. It restates the retention finding in a different unit rather than proving it twice.
| Range relative to premium reduction before 3:15 | Previous two months | Previous twelve months | Post-CAS |
|---|---|---|---|
| NIFTY DTE0 | 1.43 | 1.79 | 4.00 |
| SENSEX DTE0 | 1.60 | 2.02 | 3.95 |
| NIFTY DTE1 | 3.76 | 5.12 | 8.69 |
| SENSEX DTE1 | 4.79 | 4.63 | 4.38 |
The DTE0 increases against the twelve-month baseline pass the adjusted threshold, at approximately p = 0.031. DTE1 does not: its descriptive ratio rises about 70% for NIFTY but falls about 5% for SENSEX. These mixed estimates do not establish a common DTE1 shift.
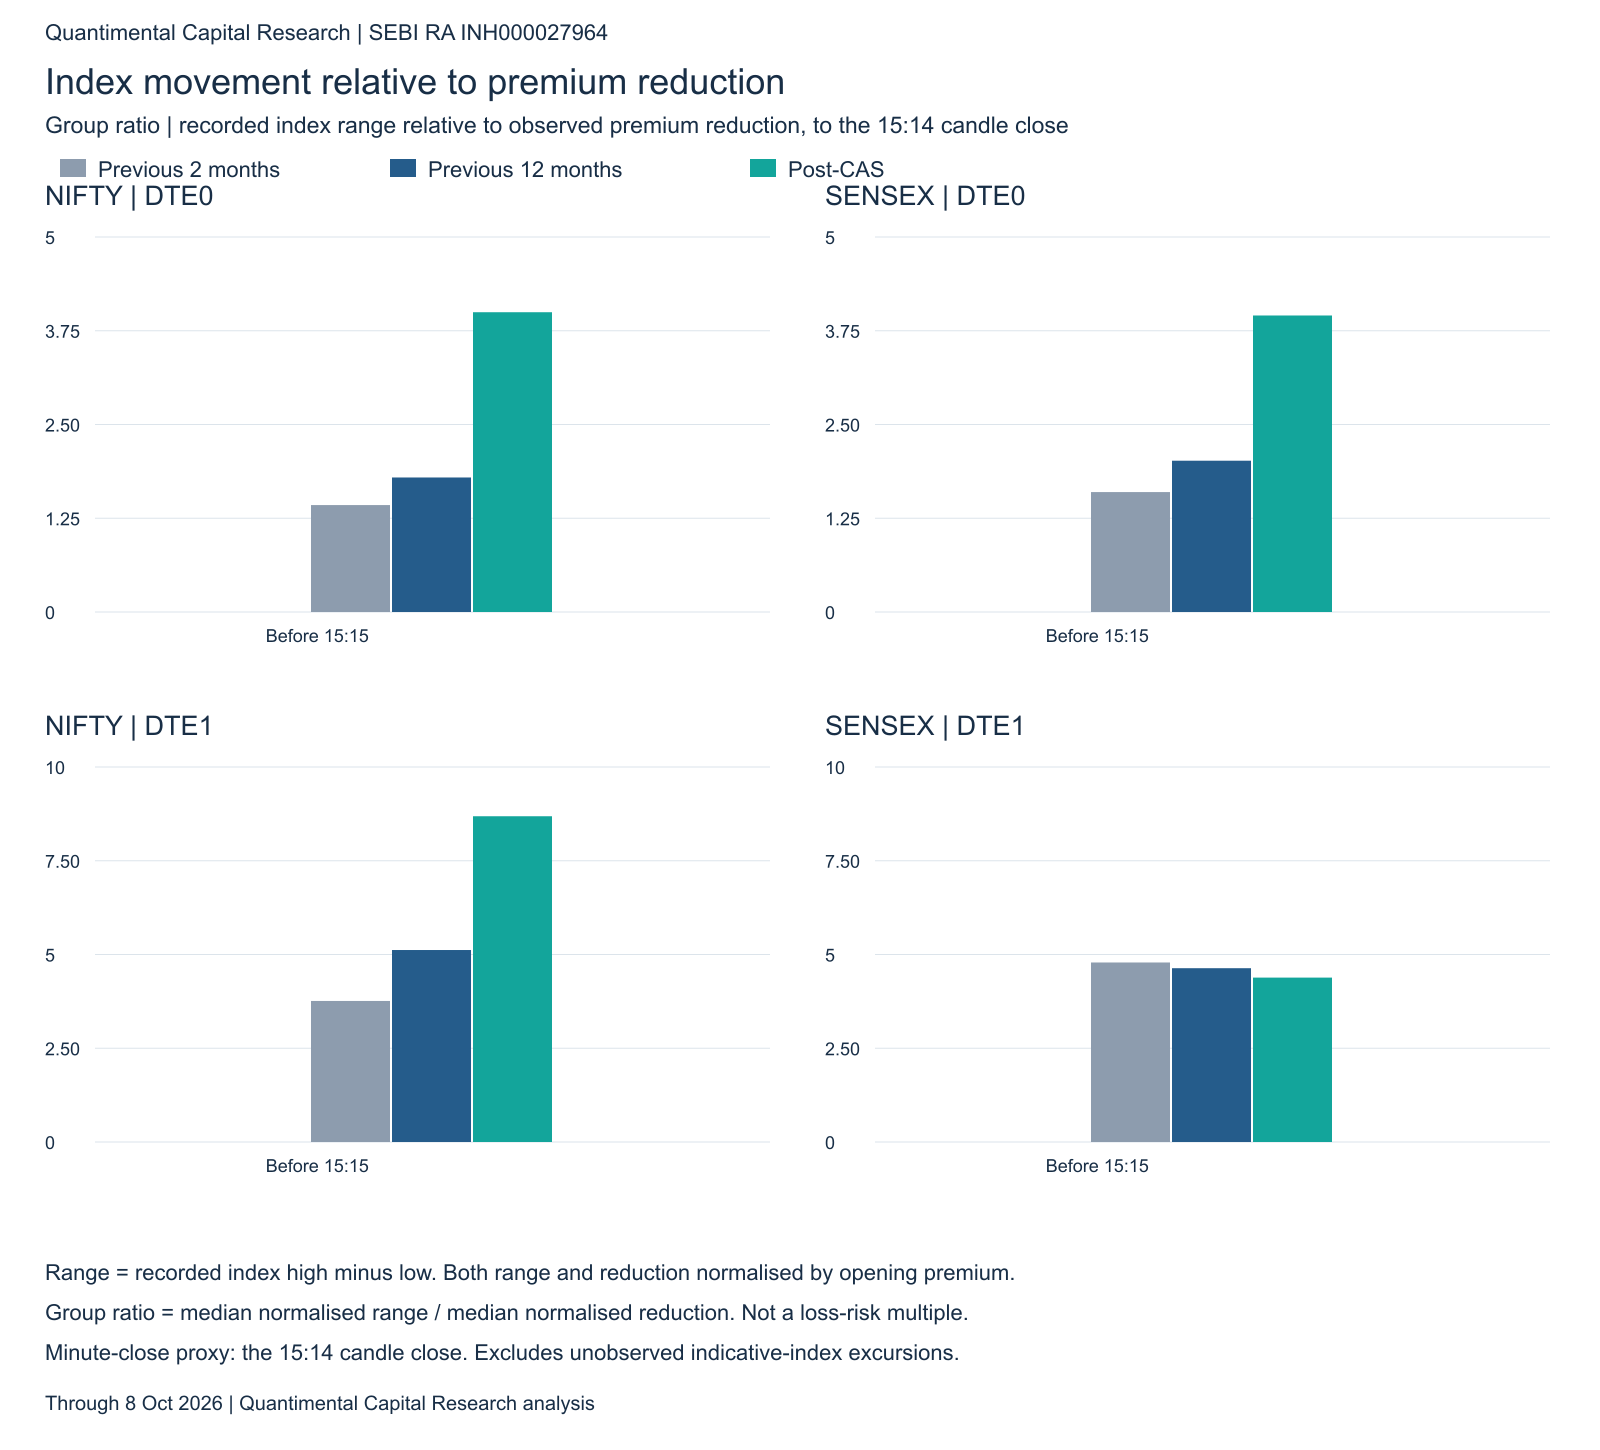
Before and after range-to-premium-reduction bars
We stop this measure at the 3:15 checkpoint for the reason given earlier: after 3:20 the eligible constituents stop trading, so an index range extended through 3:30 would compare a continuously traded market before CAS with a closed one after it. The observed profiles place more premium reduction late in the day—but a favourable endpoint can hide an adverse spike, a triggered stop or a costly exit along the way.
The increase is not the market moving more. Range divided by opening premium is 1.56 before and after for NIFTY DTE0, and for SENSEX it actually falls, from 1.81 to 1.35. The numerator held steady or shrank, so the whole increase comes from the denominator: less premium decaying during the day.
Is the effect fading across successive expiries?
The expiry-by-expiry range-to-reduction chart is uneven. Some recent sessions improved, but NIFTY and SENSEX have not moved consistently in the same direction. Adjusted chronological tests do not establish steady compression.
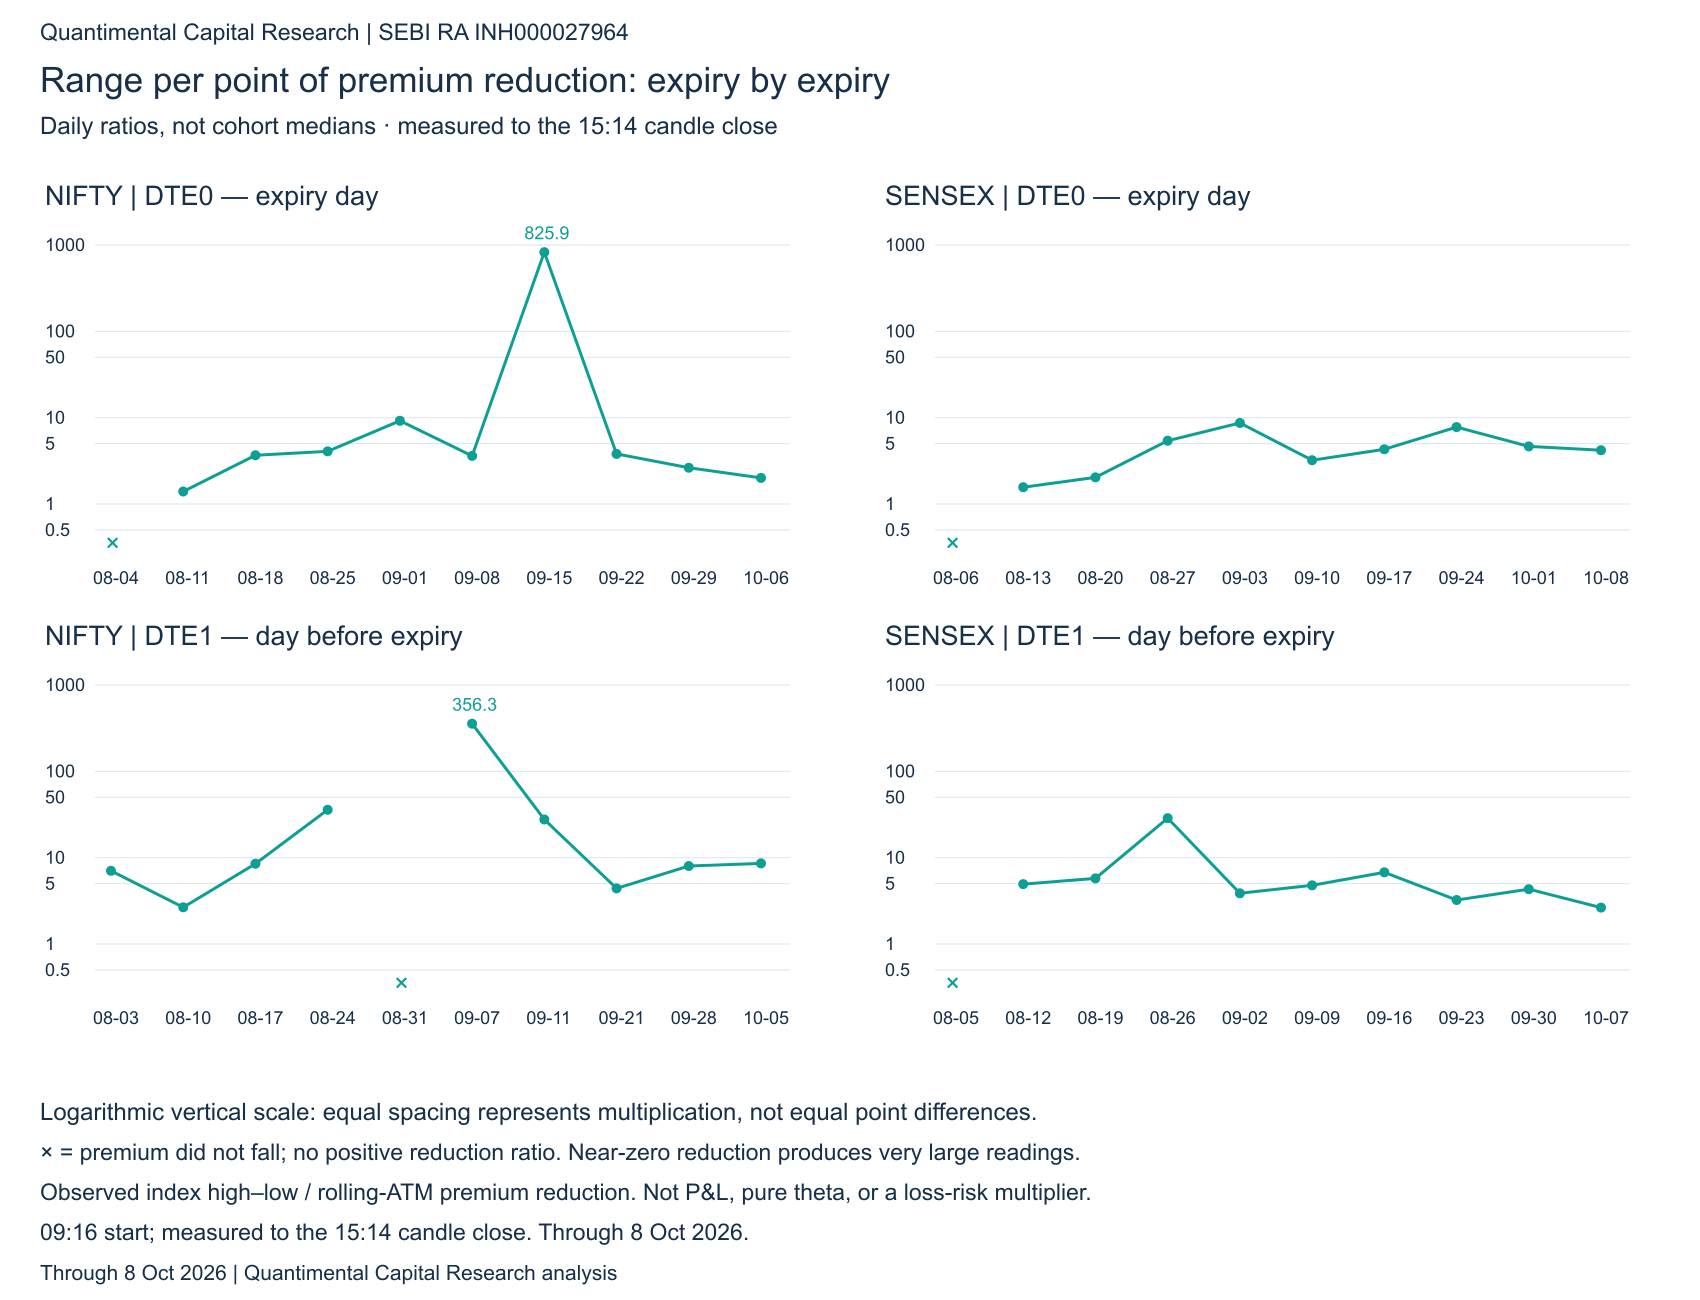
Expiry-by-expiry range-to-reduction comparisons
DTE1's curves are much closer together, particularly for SENSEX:
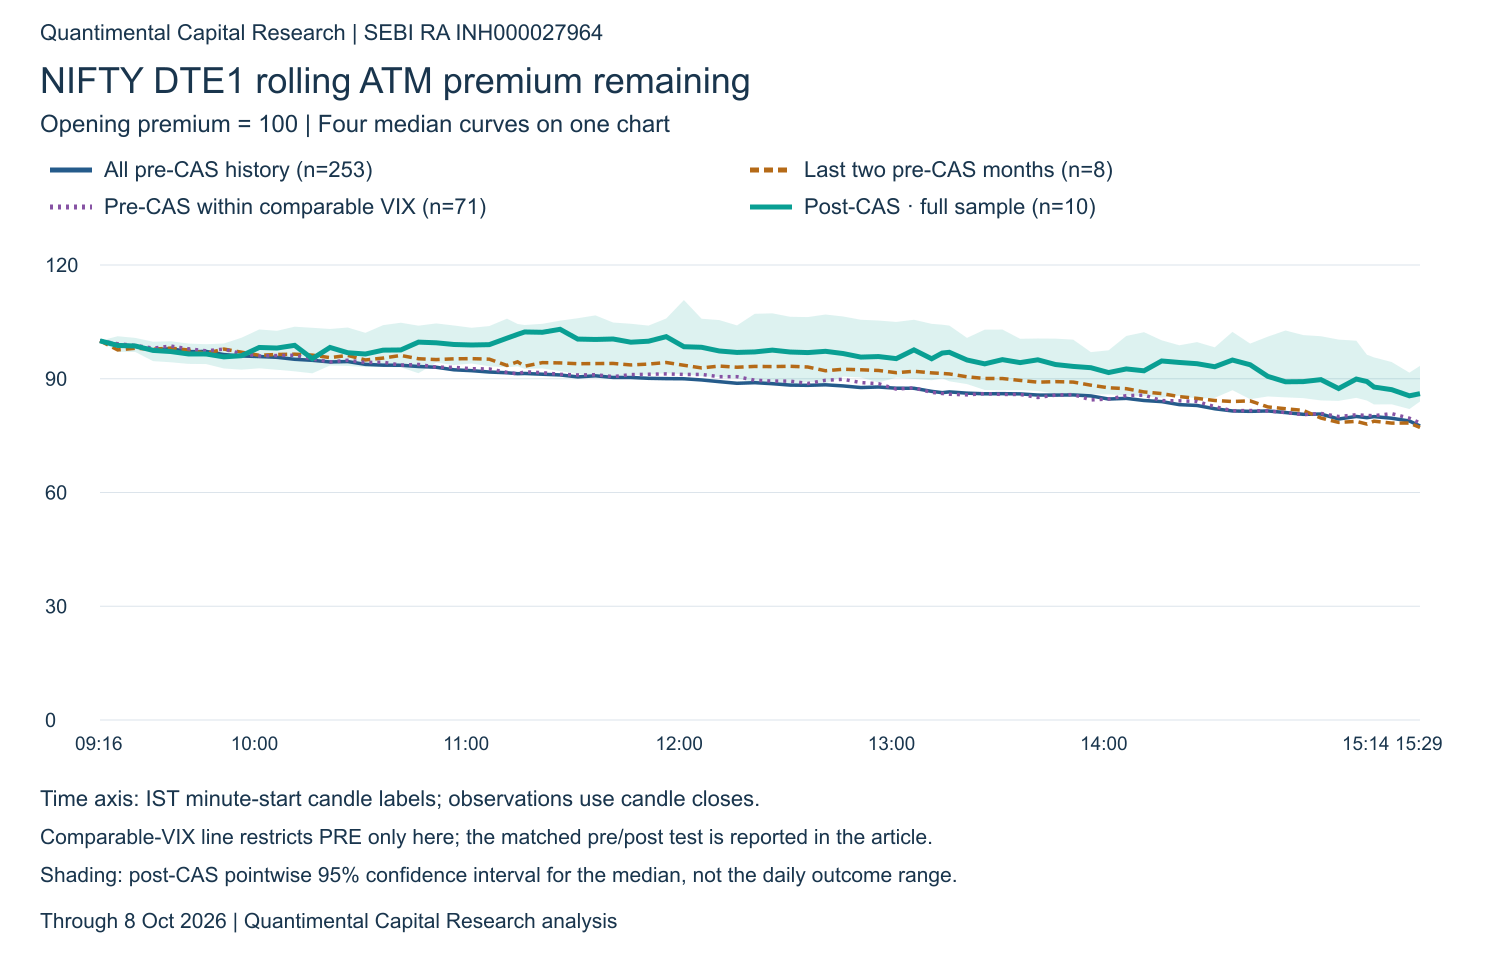
NIFTY DTE1 decay curves
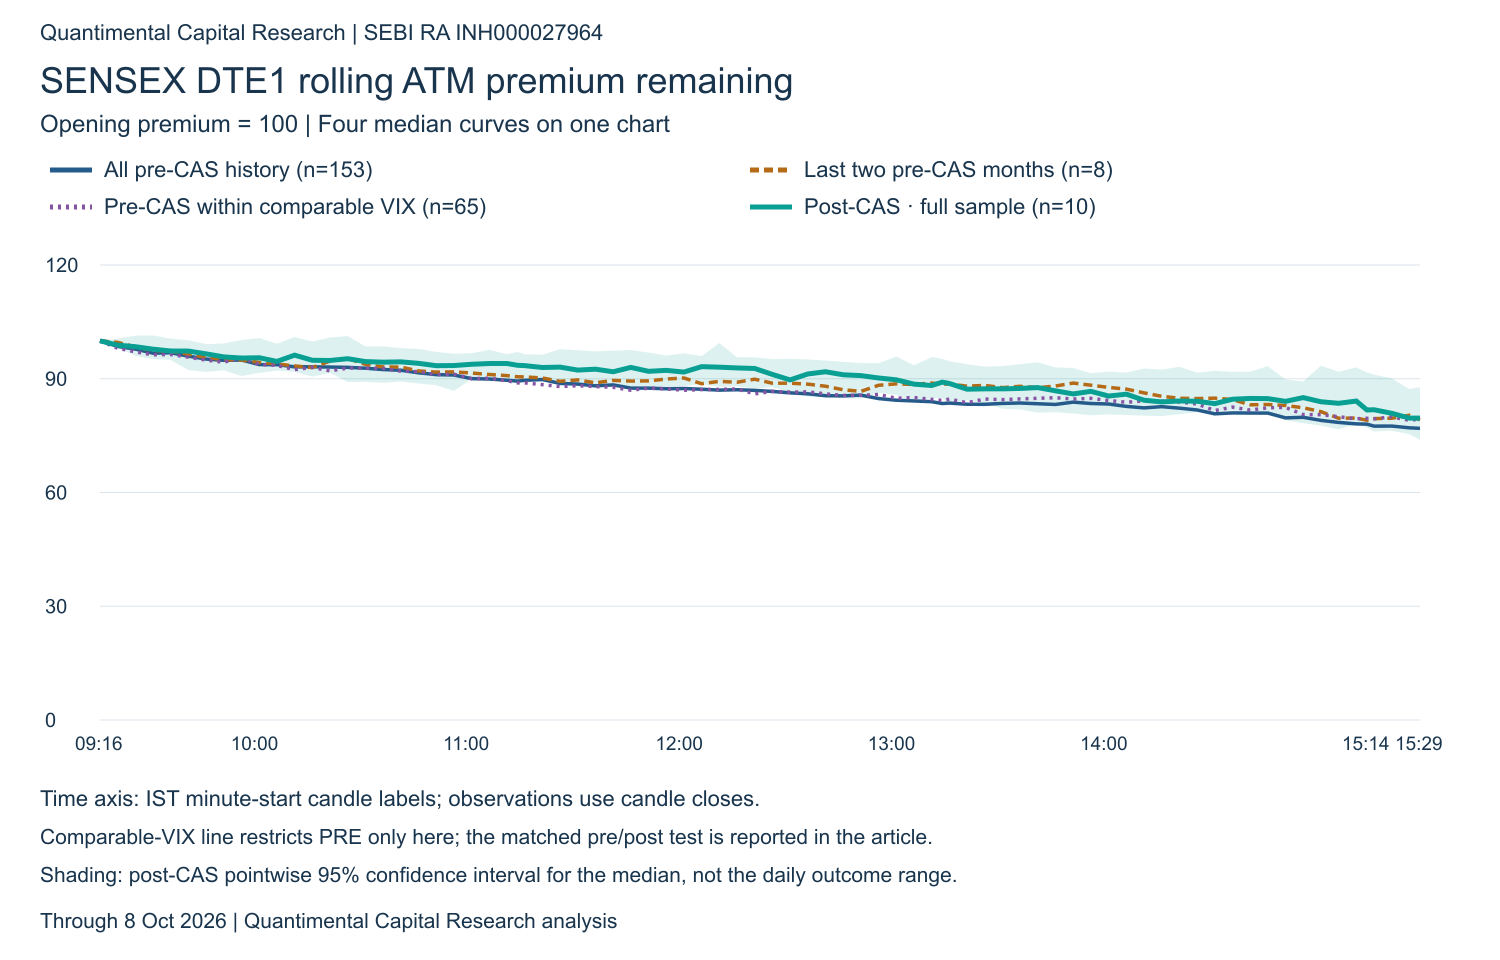
SENSEX DTE1 decay curves
Conclusion
The evidence supports a substantial delay in expiry-day premium reduction, concentrated in the afternoon. Against the twelve-month comparison, the movement a seller absorbs for each point of decay collected roughly doubled — driven by the decay falling, not by the index moving more. That is a worse trade-off at the group level, not a doubling of any seller's losses. DTE1 does not show the same statistically robust pattern.
Preserved premium is consistent with unresolved closing-price risk. Whether options increasingly react to indicative auction swings before the final close remains a separate hypothesis requiring validated paired price histories. The practical distinction is between premium that eventually disappears and the risk a position carries before it does.
Compact measurement notes
Ten post-CAS dates per index/DTE through 8 October; all-history pre samples range from 153 to 253 dates. Two-month samples contain 7–8 dates. Comparable-VIX observations fall within an overlapping band chosen from the post-CAS sample; this is a sensitivity check, not exact day-for-day matching. Results are exploratory associations: historical source changes, expiry weekdays and serial dependence remain limitations. Global Holm correction covers 306 tests; repeated p = 0.031 reflects finite permutation resolution.
Scope: every range and ratio in this article is measured to the 3:15 checkpoint, on index data whose longest identical-bar run is one minute in all 243 sessions studied. Closing-window material is limited to option premiums and is labelled as such. One closing-window price reconciliation is still open—for SENSEX on 8 October a public indicative source shows 71,566.40 at 15:29:41 against 71,593.24 in our minute series—and no conclusion in this article depends on it. Rolling checkpoint labels are 09:16, 11:14, 13:14, 15:14 and 15:29, using minute closes. The separate fixed-strike closing window uses 15:15 open to 15:29 close, covering 3:15–3:30 with minute-boundary proxies. Neither combined option quote is guaranteed executable. Group range-to-decay is median(range/opening premium) divided by median(reduction/opening premium); it is not a loss multiple. Recorded index ranges exclude unverified indicative excursions.
Research and education, not an investment recommendation.